Pixelplot of traffic data Data visualization of speed and flow of traffic
3D-printed cyber attack Data physicalization of cyber security data
Government budget Datavis for Ministry of Finance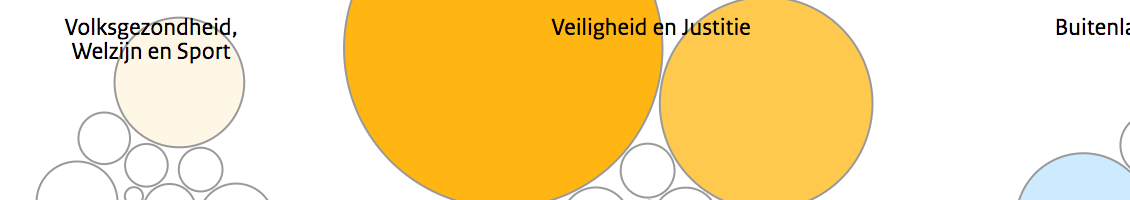
Conway’s Clock Artistic digital clock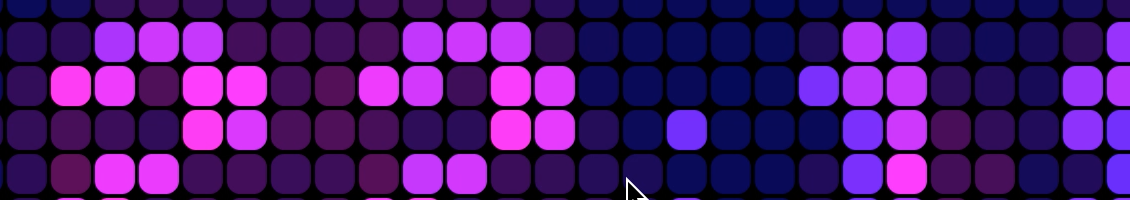
Cruz could have been in the lead Analysis of Republican voting systems
3D Subway map 3d print of Berlin’s S and U-Bahn
Zipscribble Connecting all buildings in The Netherlands
Deadliest Dinner Find out where to eat to get sick 
Slitscan experiments Playing with slitscan photography techniques 
Climate crush Compare the weather in Cairo with that in Singapore 
Spain – Holland Tweets during Worldcup soccer match 
Twelve years of rain Visualization of rain data 
Paper pixels An interactive projection about love ![]()
Fishualization Fish that reflect co-workers’ activity (@TNO) 
Pixel-based visualizations Space-efficient visualizations of sensor data (@TNO)
Your daily weather Flowers that reflect the weather 
Fluid Guide Data-driven, carpet-controlled visualization of TV programs 
Movies & Magnets Use virtual magnets to attract films of your choosing 
Retweet Ripples Visualizations of Twitter data (@TNO) 
Human Tracks A carpet that highlights your footsteps  Eurocrisis: the outliers Data visualization showing countries in trouble
  Braille for the non-blind An installation that reveals the meaning of braille
  Eatalian A former theater turned into an Italian restaurant
  Glow in the dark An interactive night stand
  Generative design An ice-cream parlour designed by chance