This is a visualization of rain data. It is a 12 x 12 grid, showing 12 months from 12 years.
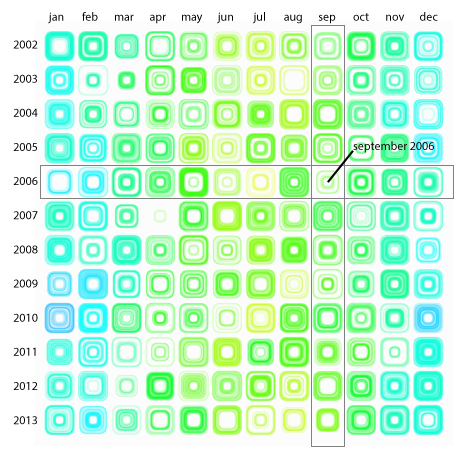
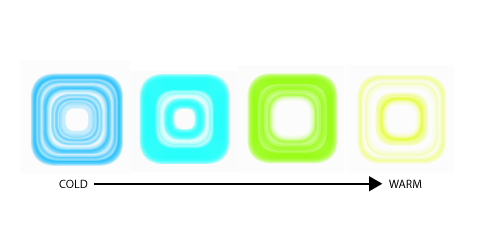
I collected data from http://www.knmi.nl for each month: average temperature per month and rainfall for each individual day of each month. Temperature is coded in color, ranging from dark blue (cold) via green to yellow (warm).
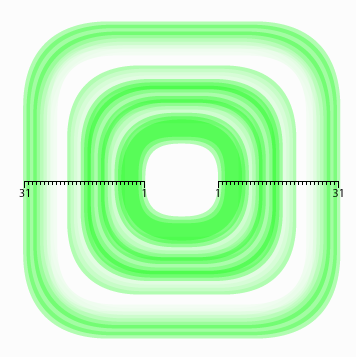
The rainfall is depicted as circles. If there was rain on a specific day a circle is drawn. If there was no rain, no circle is drawn. Circles go from inside (first day of the month) to outside (last day of the month), so the radius of a circle represents the day of the month.
By using thick transparent lines for each circle, some beautiful patterns occur when circles overlap: