
(Click image for high-res version). These are 221.000 Dutch tweets sent during the soccer match Spain-Holland at the Worldcup 2014. Each dot is a tweet. The horizontal axis represents time, the vertical axis shows the level of excitement of each tweet. The peaks of excitement at each (Dutch) goal are clearly visible.
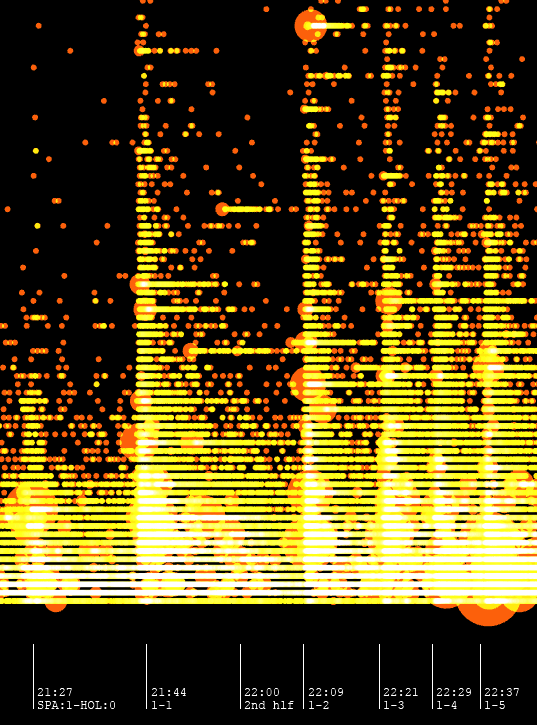
Each dot is orange (of course). When lots of dots are overlapping the color becomes brighter (from orange via yellow to white). White areas in the image show high concentration of tweets.
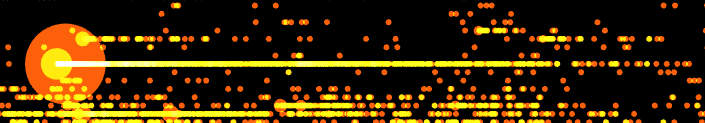
The size of each dot represents the number of retweets the tweet has. The large circle in the image below is a tweet from the FIFA announcing the line-up for the game:
“#NED LINE-UP: Cillessen, Vlaar, De Vrij, Blind, De Jong, Van Persie (c), Sneijder, Robben, Verhaegh, Kuyt, Wijnaldum #NEDMEX #WorldCup”
It got 2500 retweets.
The excitement of a tweet is calculated rather straightforward: it is a weighed sum of the number of exclamation marks and the number of capital characters in the tweet. An example of a tweet with a high level of excitement is:
“GOOOOOOOOOOOOOOOOOOOOOOOOOOOOOOOOOOOOOOOOOOOOOOOOOOOOOOOOAL HUNTELAAAAAAAAAAAAAAAAAAAAAAAAAAAAAAAAAAAAAAAAAAAAAAAAAAAAAAAAAAAAAAAAAAR #NED”
And one with a low level of excitement:
“met mijn ma moet je echt geen voetbal kijken..
”
(you should not watch soccer with my mom)
The tweets were collected using the Twitter Streaming API, accessed via the Twitter4J library for Java (twitter4j.org). The visualization was featured on visualising.org.