This project was done for TNO, the major research institute in The Netherlands. We investigated to what extend a physical representation of data (a.k.a. ‘physicalization‘) could improve the understanding of data, or more specific: could improve anomaly detection in a large dataset.
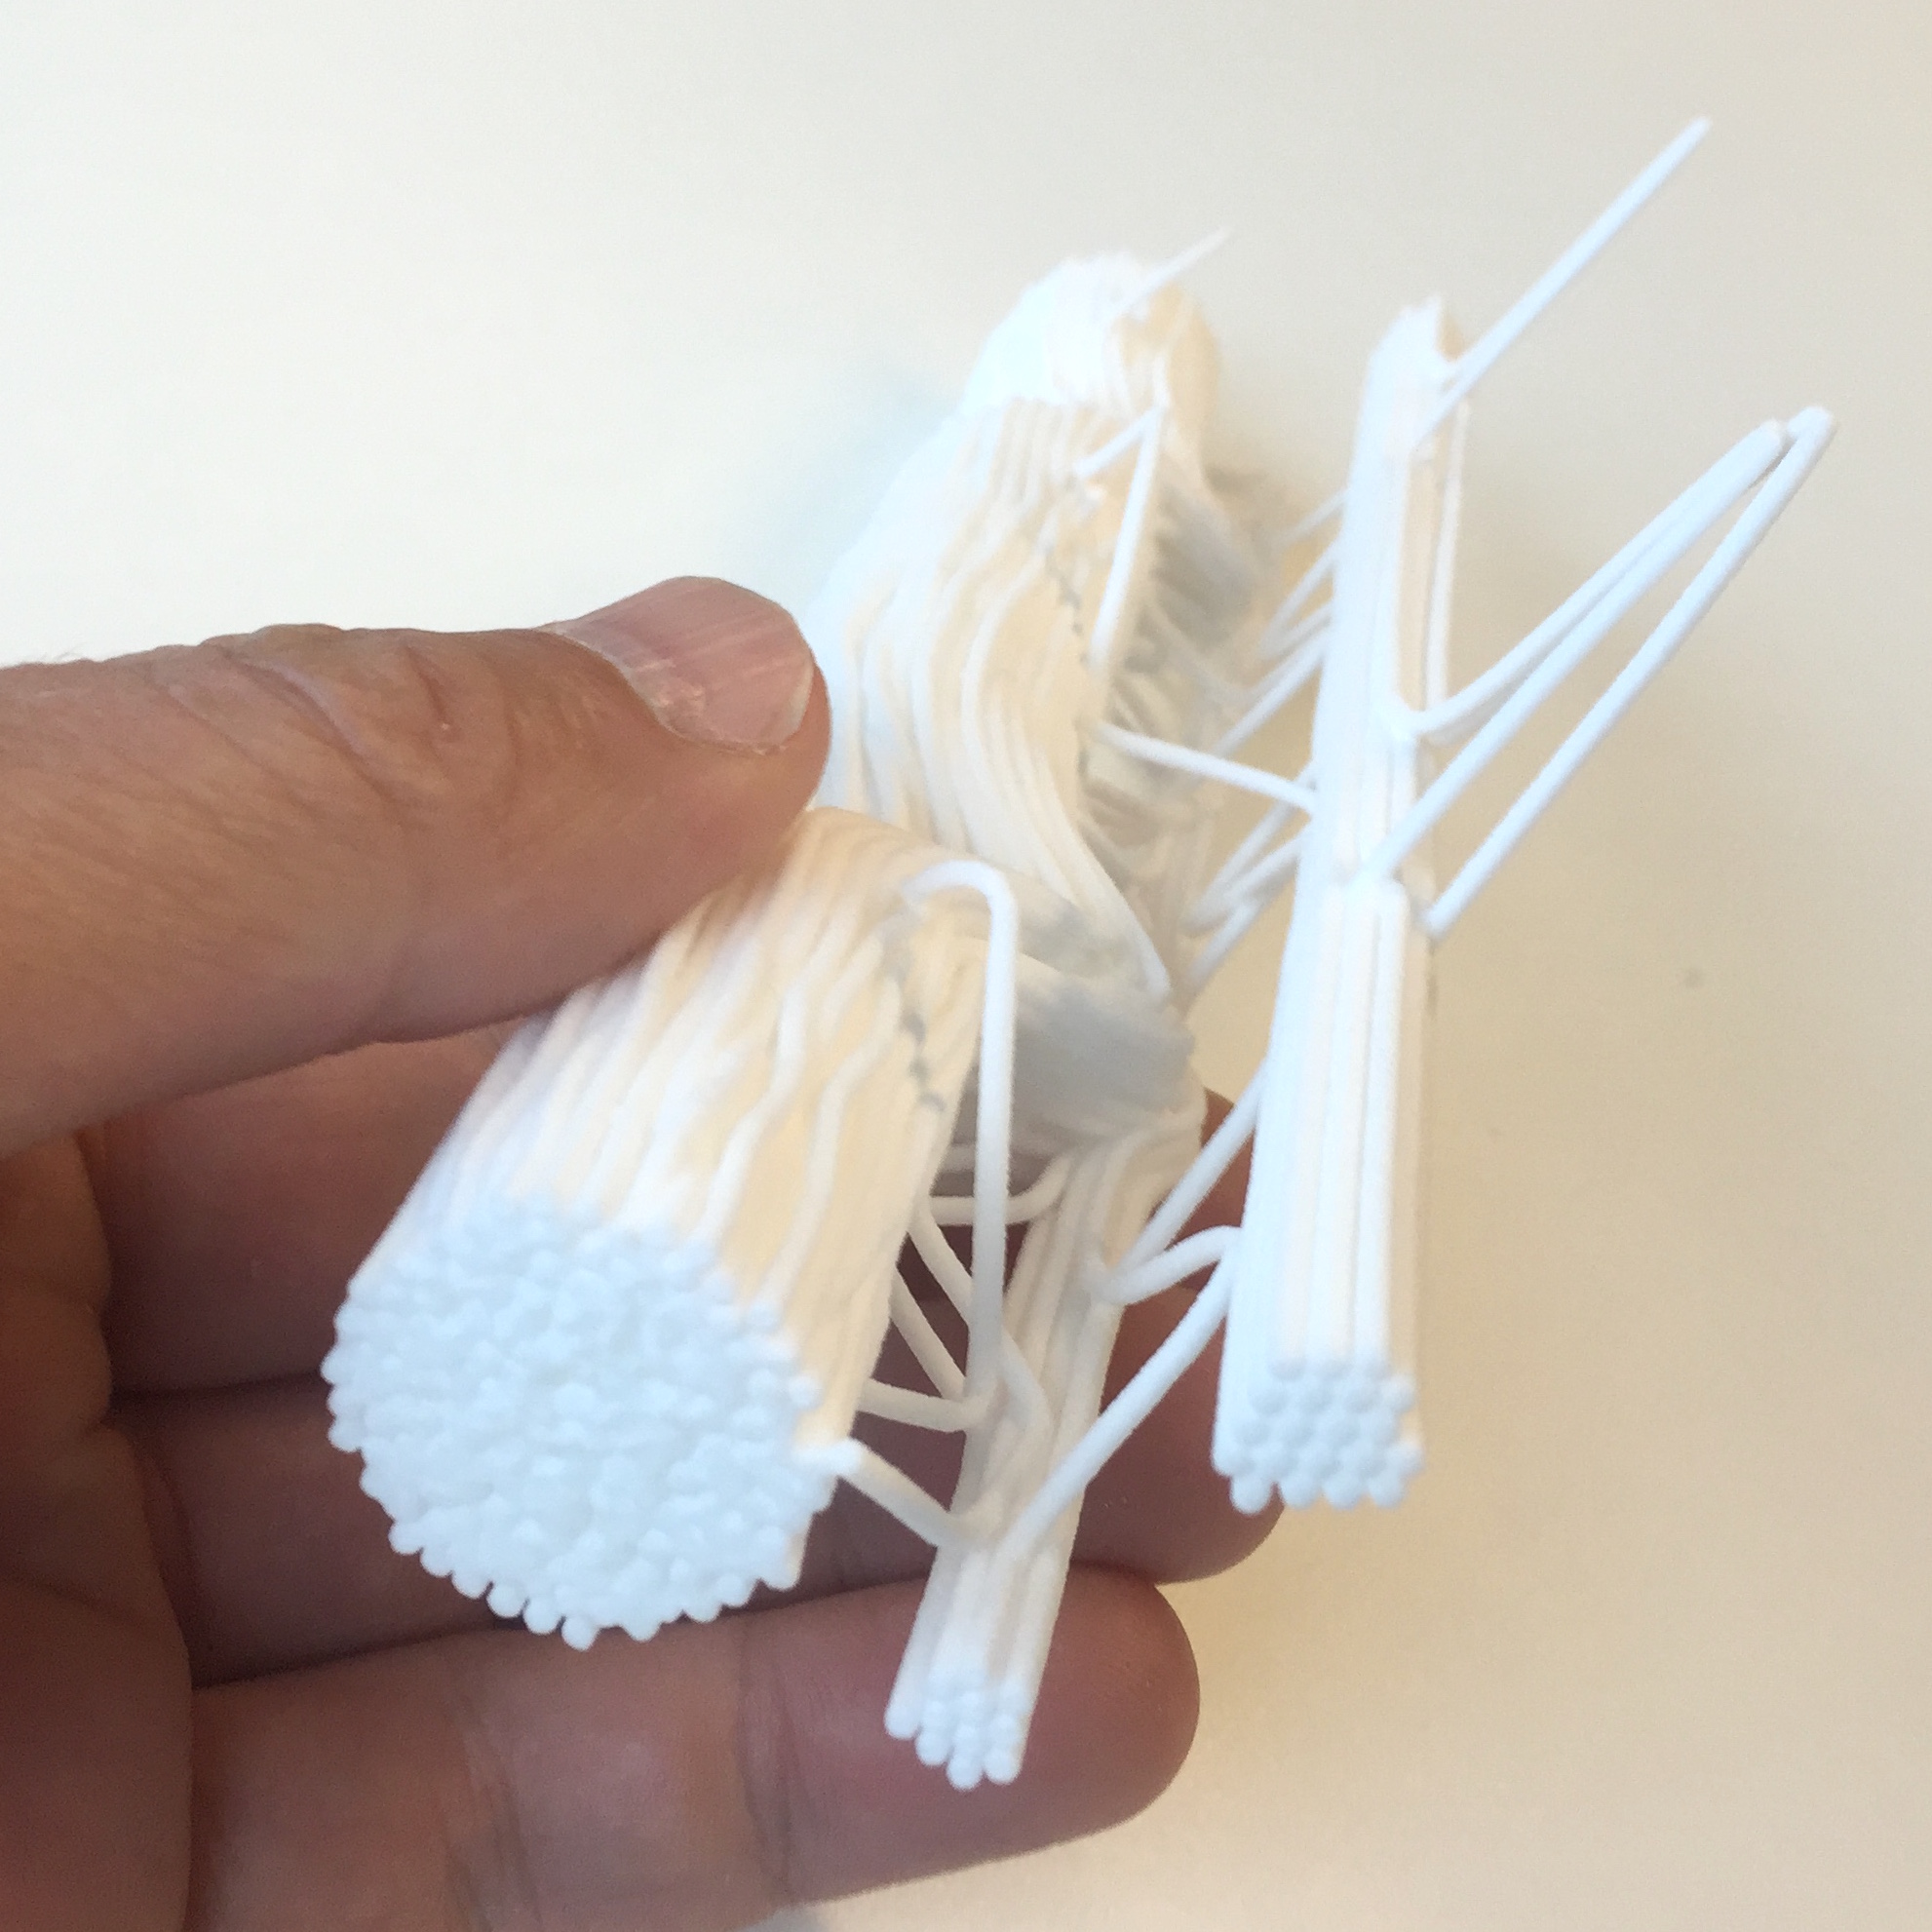
The object is in fact a 2D-scatterplot, where the third axis is used for time: so it displays a scatterplot-through-time. Each string is a computer, its position on the x and y axis indicate the number of incoming and outgoing connections to that computer. Strings that are straight, represent computers for which the number of incoming and outgoing connections do not change. The two spikes in the image above indicate computers that suddenly have a lot of outgoing connections, twice during the time period. Those are malicious computers, connecting to a lot of other computers, trying to infect those with a virus.