 (Click the image to launch the interactive version)
This interactive visualization is my entry for the Climate Crush weather data visualization contest (weatheranalytics.com/wa/climate-crush). Weather Analytics provided several data sets containing weather data. I used the ‘Global Contrast’ dataset containing the last five years of weather conditions for Singapore and Cairo. The goal was to show how the climate in those two cities differ.
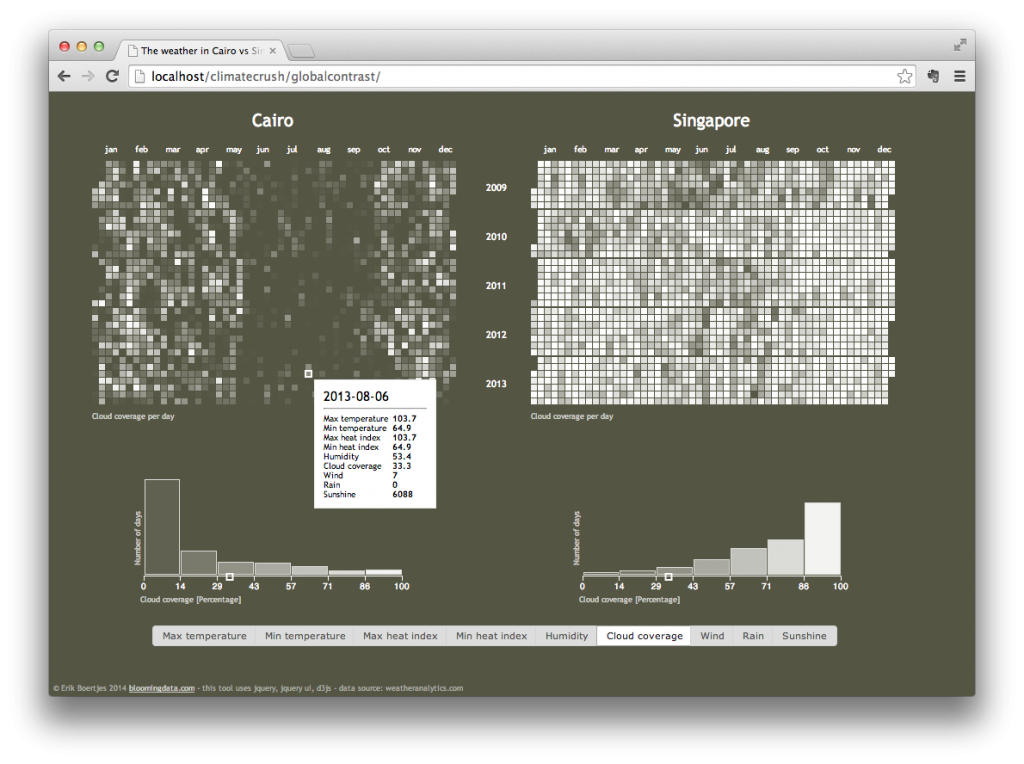
I chose to visualize the data in a simple yet effective way. The upper part is a heatmap, showing either temperature, sunshine, rain etc. per day for the period of five years. A series of buttons at the bottom allows the user to choose the type of data to show (temperature, sunshine, rain, etc.). Hovering over the heatmap shows details for each individual day.
Since the original data was on an hour basis, I had to aggregate the data to get values per day. For temperature I calculated minimum and maximum values per day. For rain I calculated the sum over all the hours of the day. From the example above you can clearly see that cloud coverage in Cairo has a pattern following the seasons: less clouds in summer, more clouds in winter. Singapore however has clouds all year round, there is hardly any seasonal pattern visible (which is explained by the fact that Singapore lays closer to the equator than Cairo).
The lower part of the visualization is a histogram (one for each city). It shows the number of data days that lie within a range of values. In the example above it shows that in Cairo most days are cloudless (they fall in the 0-14 range) while in Singapore most days are cloudy (they fall in the 86-100 range).
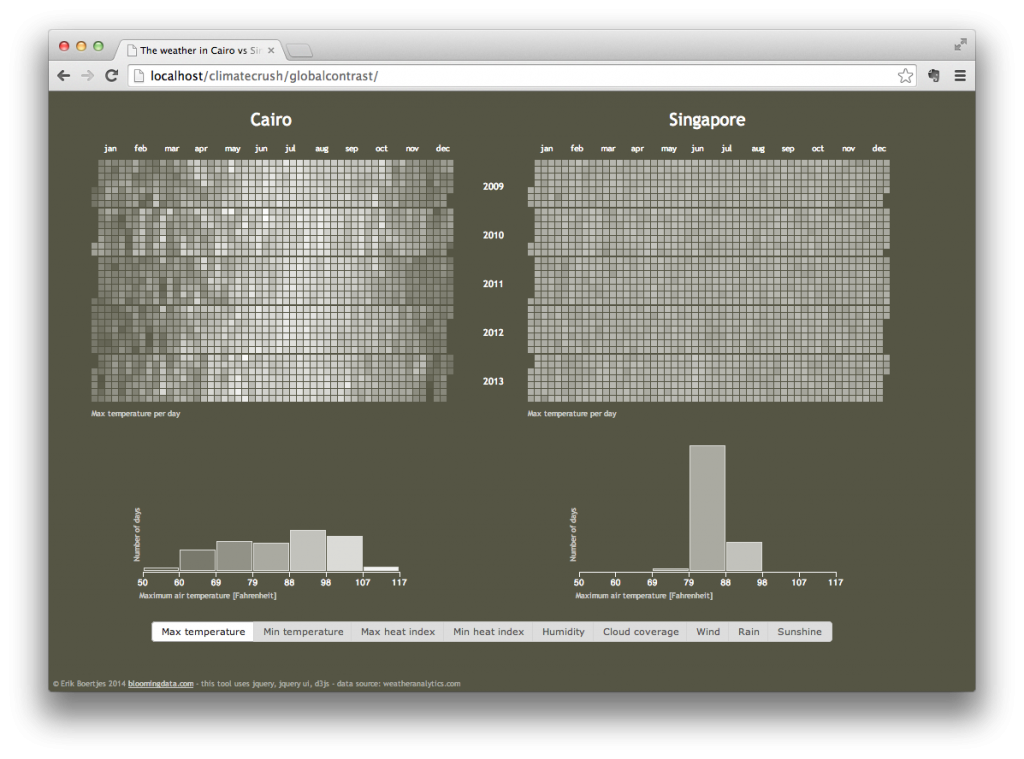 The example above shows the maximum temperature on each day during 2009-2013. Again, because of the proximity to the equator, the visualization shows hardly any seasonal changes for Singapore but does show summer / winter pattern for Cairo. This is confirmed by the histograms: temperature values for Cairo are distributed over the whole range while almost all temperature values for Singapore fall in one range (79-88 °F).