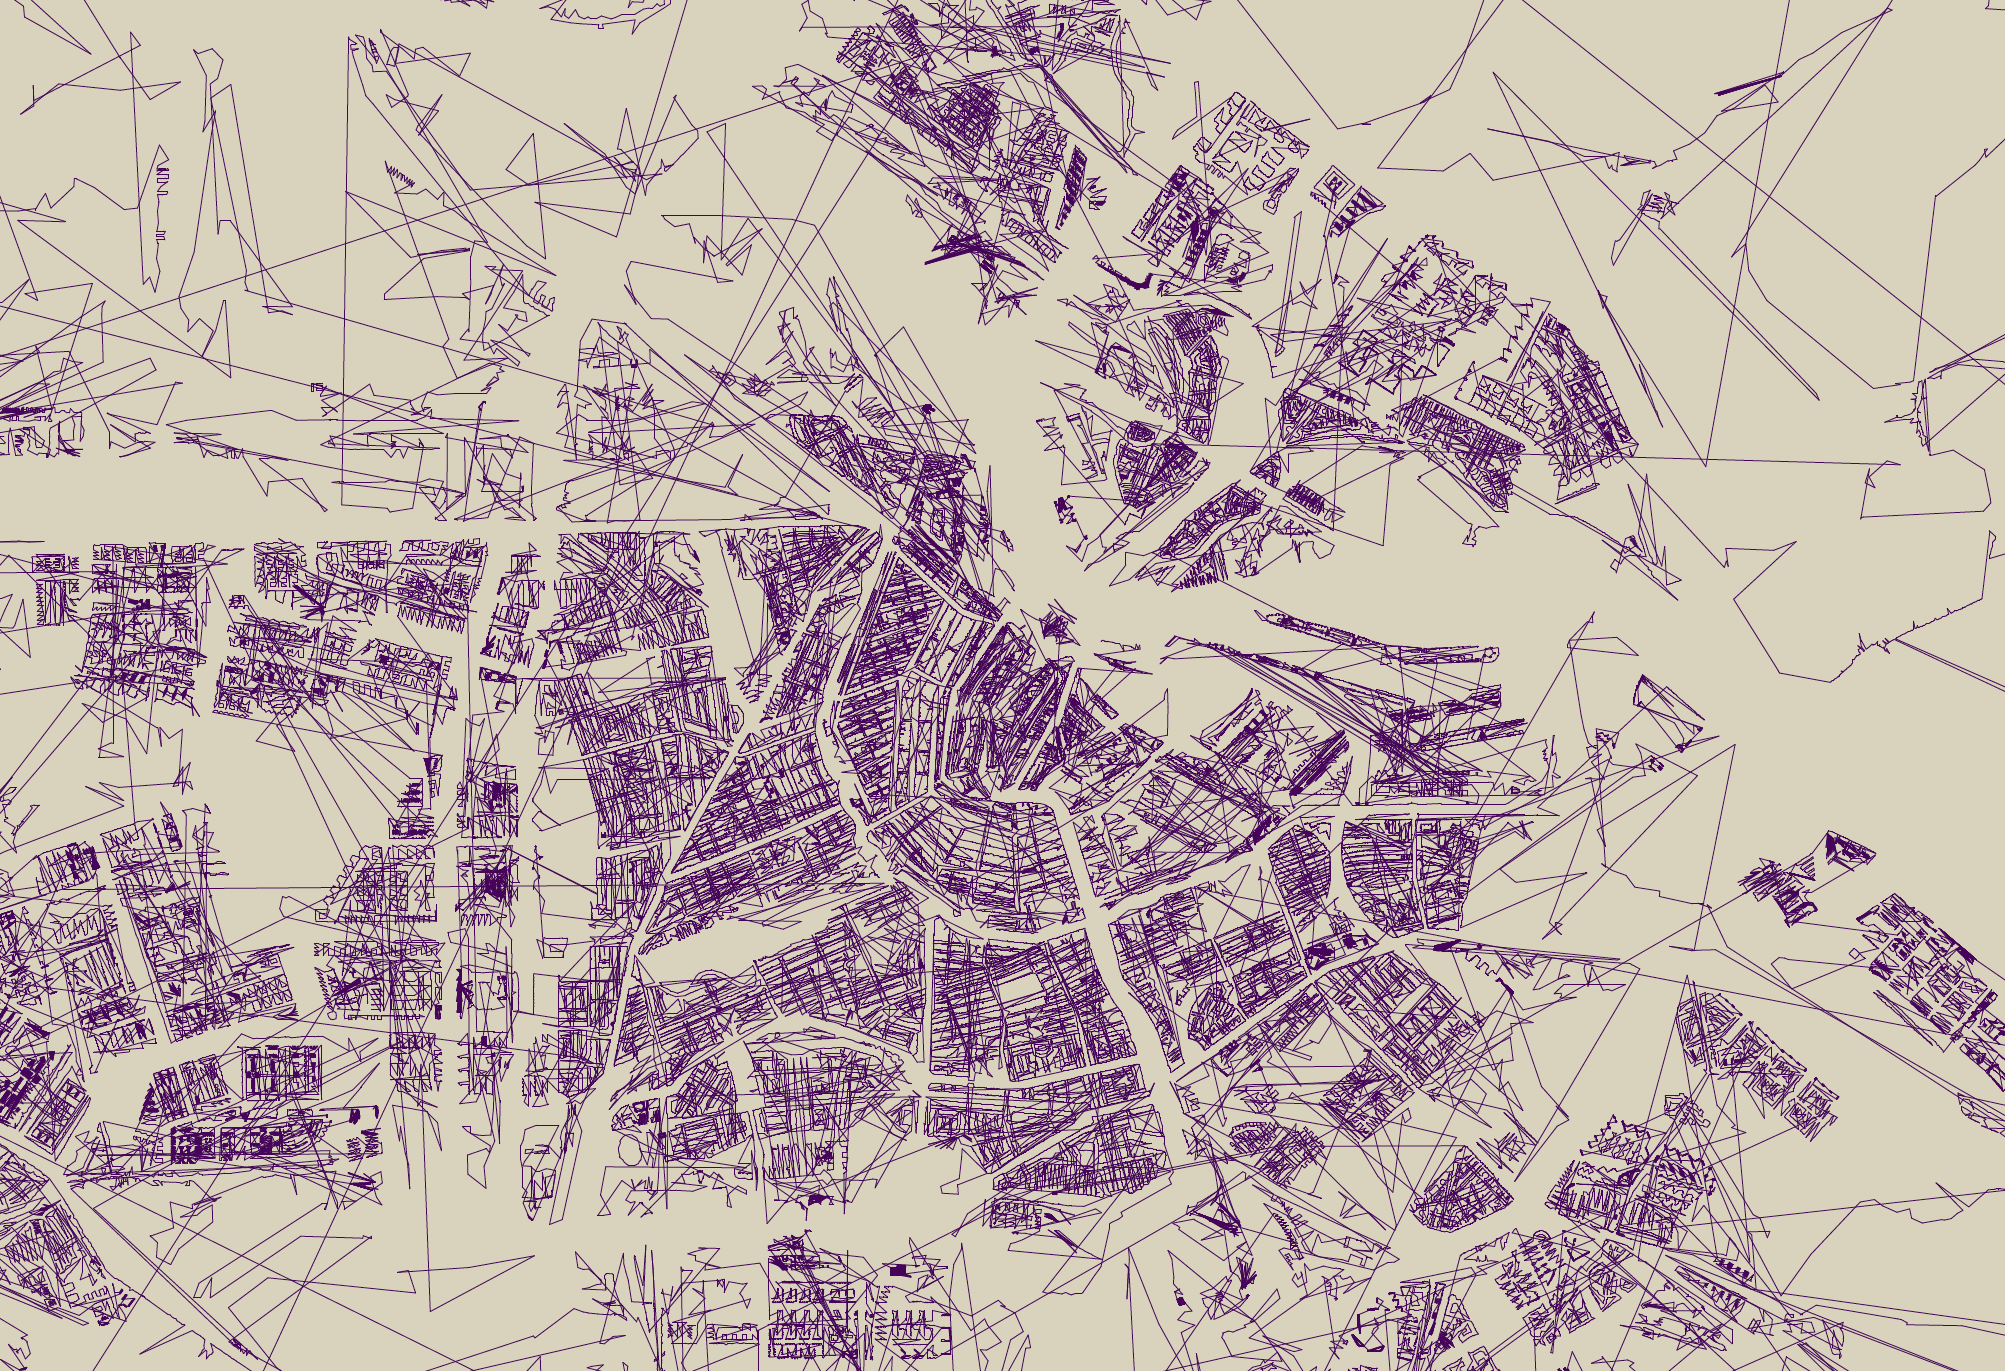
 Zipscribbles have been around for quite a while, see this one of the US. Recently, I got hold of the location (in geo-coordinates) of each address in The Netherlands, and created a zipscribble based on that dataset. The idea is very simple: all addresses are sorted according to zipcode and housenumber, starting from 1011 AB 105 and ending, 9 million addresses later, at 9999 XL 15. I connected the location of the first address with a line to the second address, the second address to the third, etc. until the whole country is ‘scribbled together’.
This visualization turned out to be an efficient way of detecting anomalies in the data. The ‘spike’ in the image below, indicates an address whose location is very far from its immediate neighbours.
Using an online tool the address turns out to be non-existent.
I wrote a small script to detect such outliers automatically, based on the ‘spykiness’ of the shapes in the zip scribble drawing. Around two thousand outliers (of the 9M addresses) were found that way, and deleted from the data set before rendering the images.