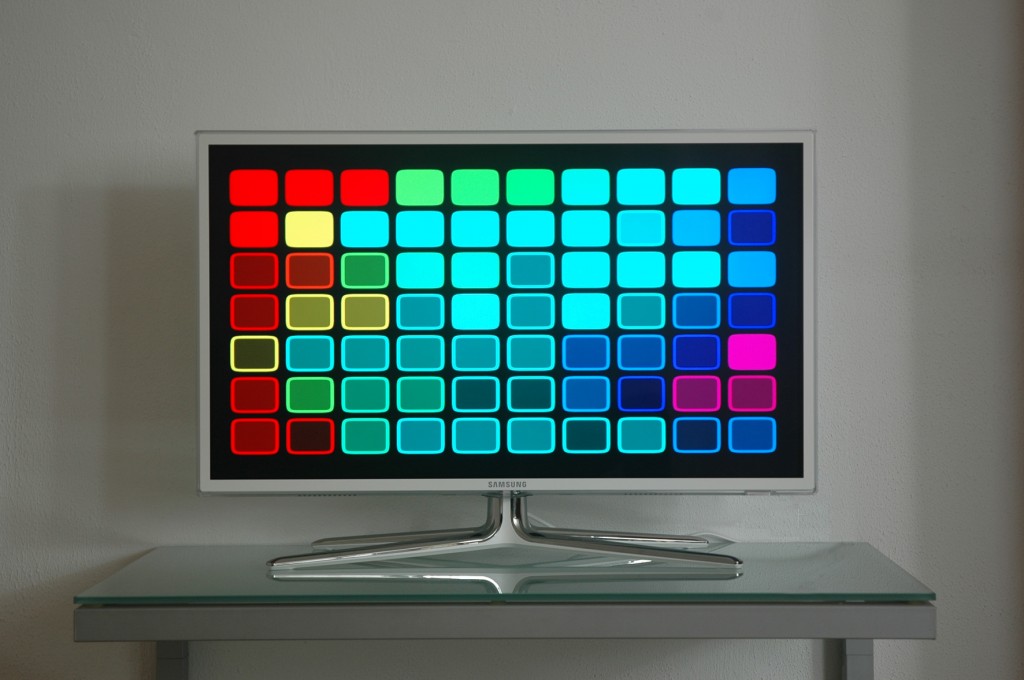
Fluid Guide is a living painting driven by TV guide data. By stepping on the tiles of the accompanying carpet you select certain genres to be displayed, or ask for program details to be shown.
The visualization
Normally, TV guides are organized according to channel and start time of the program. In Fluid Guide the channels do not take such a prominent role in positioning the data. Instead, programs are organized according to genre (horizontally) and time (vertically). The color of a square indicates the genre of its program. The transparency of the square indicates the time before the program will start.
Laying out the tiles on the screen (i.e. determine which tile comes where) is done by two algorithms: one algorithm is used to initialize the visualization and places the tiles at the start. The other algorithm incrementally adapts the layout, whenever a program has ended. Both algorithms maintain a fixed ordering of genres (the colors) in the horizontal direction. So the red tiles (news) will always be left of the yellow ones (documentaries). Within a row, all tiles with the same color are grouped together, e.g.: there is no yellow tile between the red ones. In the vertical direction, the is according to start time: programs that are more to the top will start sooner than those more to the bottom of the screen.
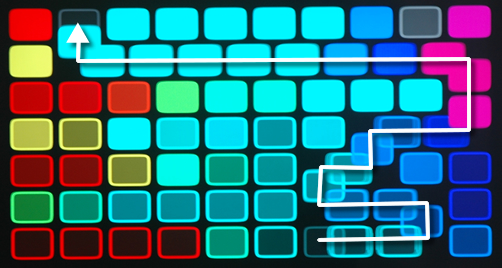
The initialization program is rather simple, and starting with an empty screen, all programs can be laid out according to the rules above. The incremental algorithm is slightly more complicated. Whenever a program ends, its tile is taken from the screen, leaving an empty gap. I wanted the algorithm to fill the gap by shuffling programs upwards like in a slide puzzle, so the gap will end up in the bottom row and can be filled with a new program. It took some experimentation (with paper tiles) to get a proper algorithm.
I also experimented with adding a third dimension, having the tiles (using shadow effects) coming towards you. This dimension could be used to have pop out programs that may be expecially interesting, based on your profile, or based on reviews (like reviews from IMDB). Who knows, in some future version ![]()
The data
To get TV guide data, I use ‘mc2xml‘ which is a very useful command-line program that downloads TV program listings and stores them in XMLTV format. You can tell the program the region you live in, and it downloads the listings for the channels that are available to you. For my region (The Hague, The Netherlands) it downloads program information of 11000 programs for 34 channels for 4 days at a time. I would download these listings typically once a day, so the Fluid Guide provides information for at least 3 days in advance.
The carpet
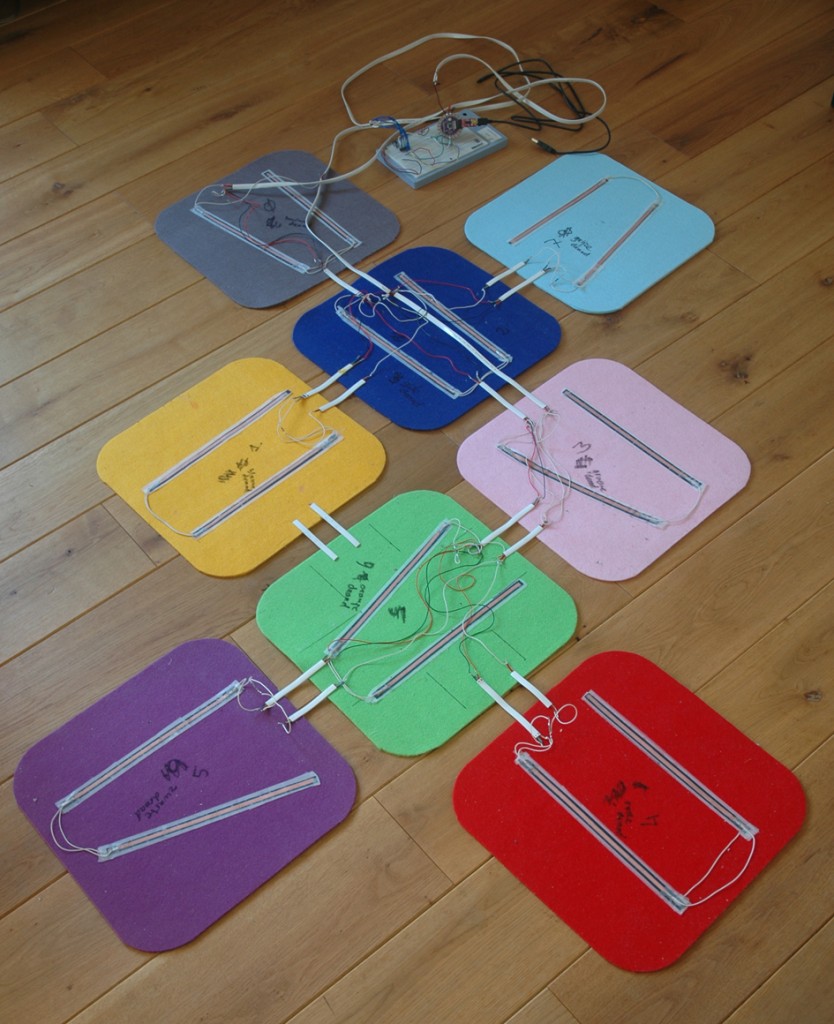
I chose to have a carpet as the device to control the visualization, but it may as well have been controlled by a remote control, or by voice. Each carpet-tile corresponds to a genre. Stepping on it fills the screen with programs of the corresponding genre. Multiple genres can be selected by quickly stepping from one tile to the other. One carpet-tile (the grey one) causes the program details to be shown.
The carpet consists of eight tiles. I took various colours of felt, and cut them into rounded squares (to mimic the squares on the screen). Each carpet tile consists of two of those felt squares, with sensors in between.
The sensors are made of two layers of copper fabric. Between those layers I put a material called ‘Velostat’. Velostat is a piezoresistive material which means that it conducts electricity and its resistance increases when the material is under pressure. I use this property to detect whether someone is standing on a carpet tile: the Velostat starts conducting and the measured voltage increases (see sketch below).
Soldering right on the copper fabric is a bad idea. I first glued a small piece of 3M copper tape on the fabric, and then soldered the wire to the tape. That worked like a charm!
The Arduino
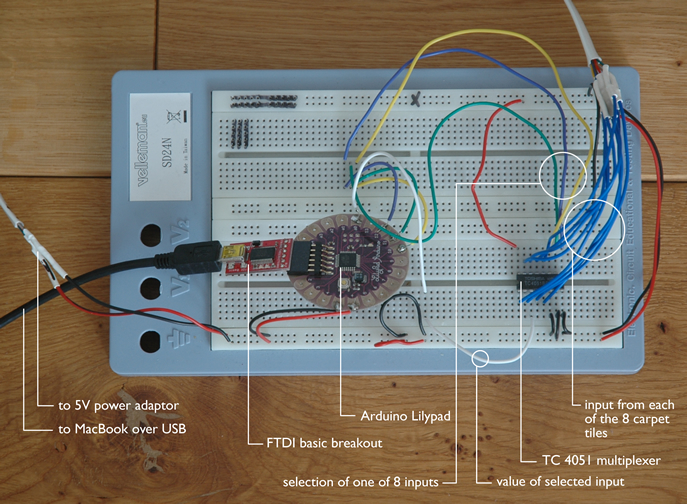
The Arduino (I took the Lilypad, but it could be any Arduino) is used to periodically read all sensor values. Based on these values it concludes whether someone is standing on one of the carpet tiles. If so, its sends a message over the serial bus to my MacBook where a Processing program handles the input and adapts the visualization on the screen.
Powering the Arduino causes it to read the sensor values of each of the carpet tiles, storing them as being the ‘rest values’. These are the values against which all future readings will be compared. If the difference is large enough (checking it against a fixed relative increase) the Arduino concludes that somenone is standing on the carpet tile. At least, that was the idea. It turned out that the values-in-rest slowly changed in time, so I had to make the program adapt them constantly. I used a sliding window, storing a couple of values-in-rest per carpet tile, and used the average of those values as the value-in-rest.
Since the number of analogue inputs on my Arduino Lilypad is not sufficient (it has 6 and I needed 8), I used a 4051 multiplexer. It enables you to expand the in- and outputs on your Arduino board. There is an excellent tutorial on how to do this on the Arduino Playground wiki.


